Supply Chain Analytics
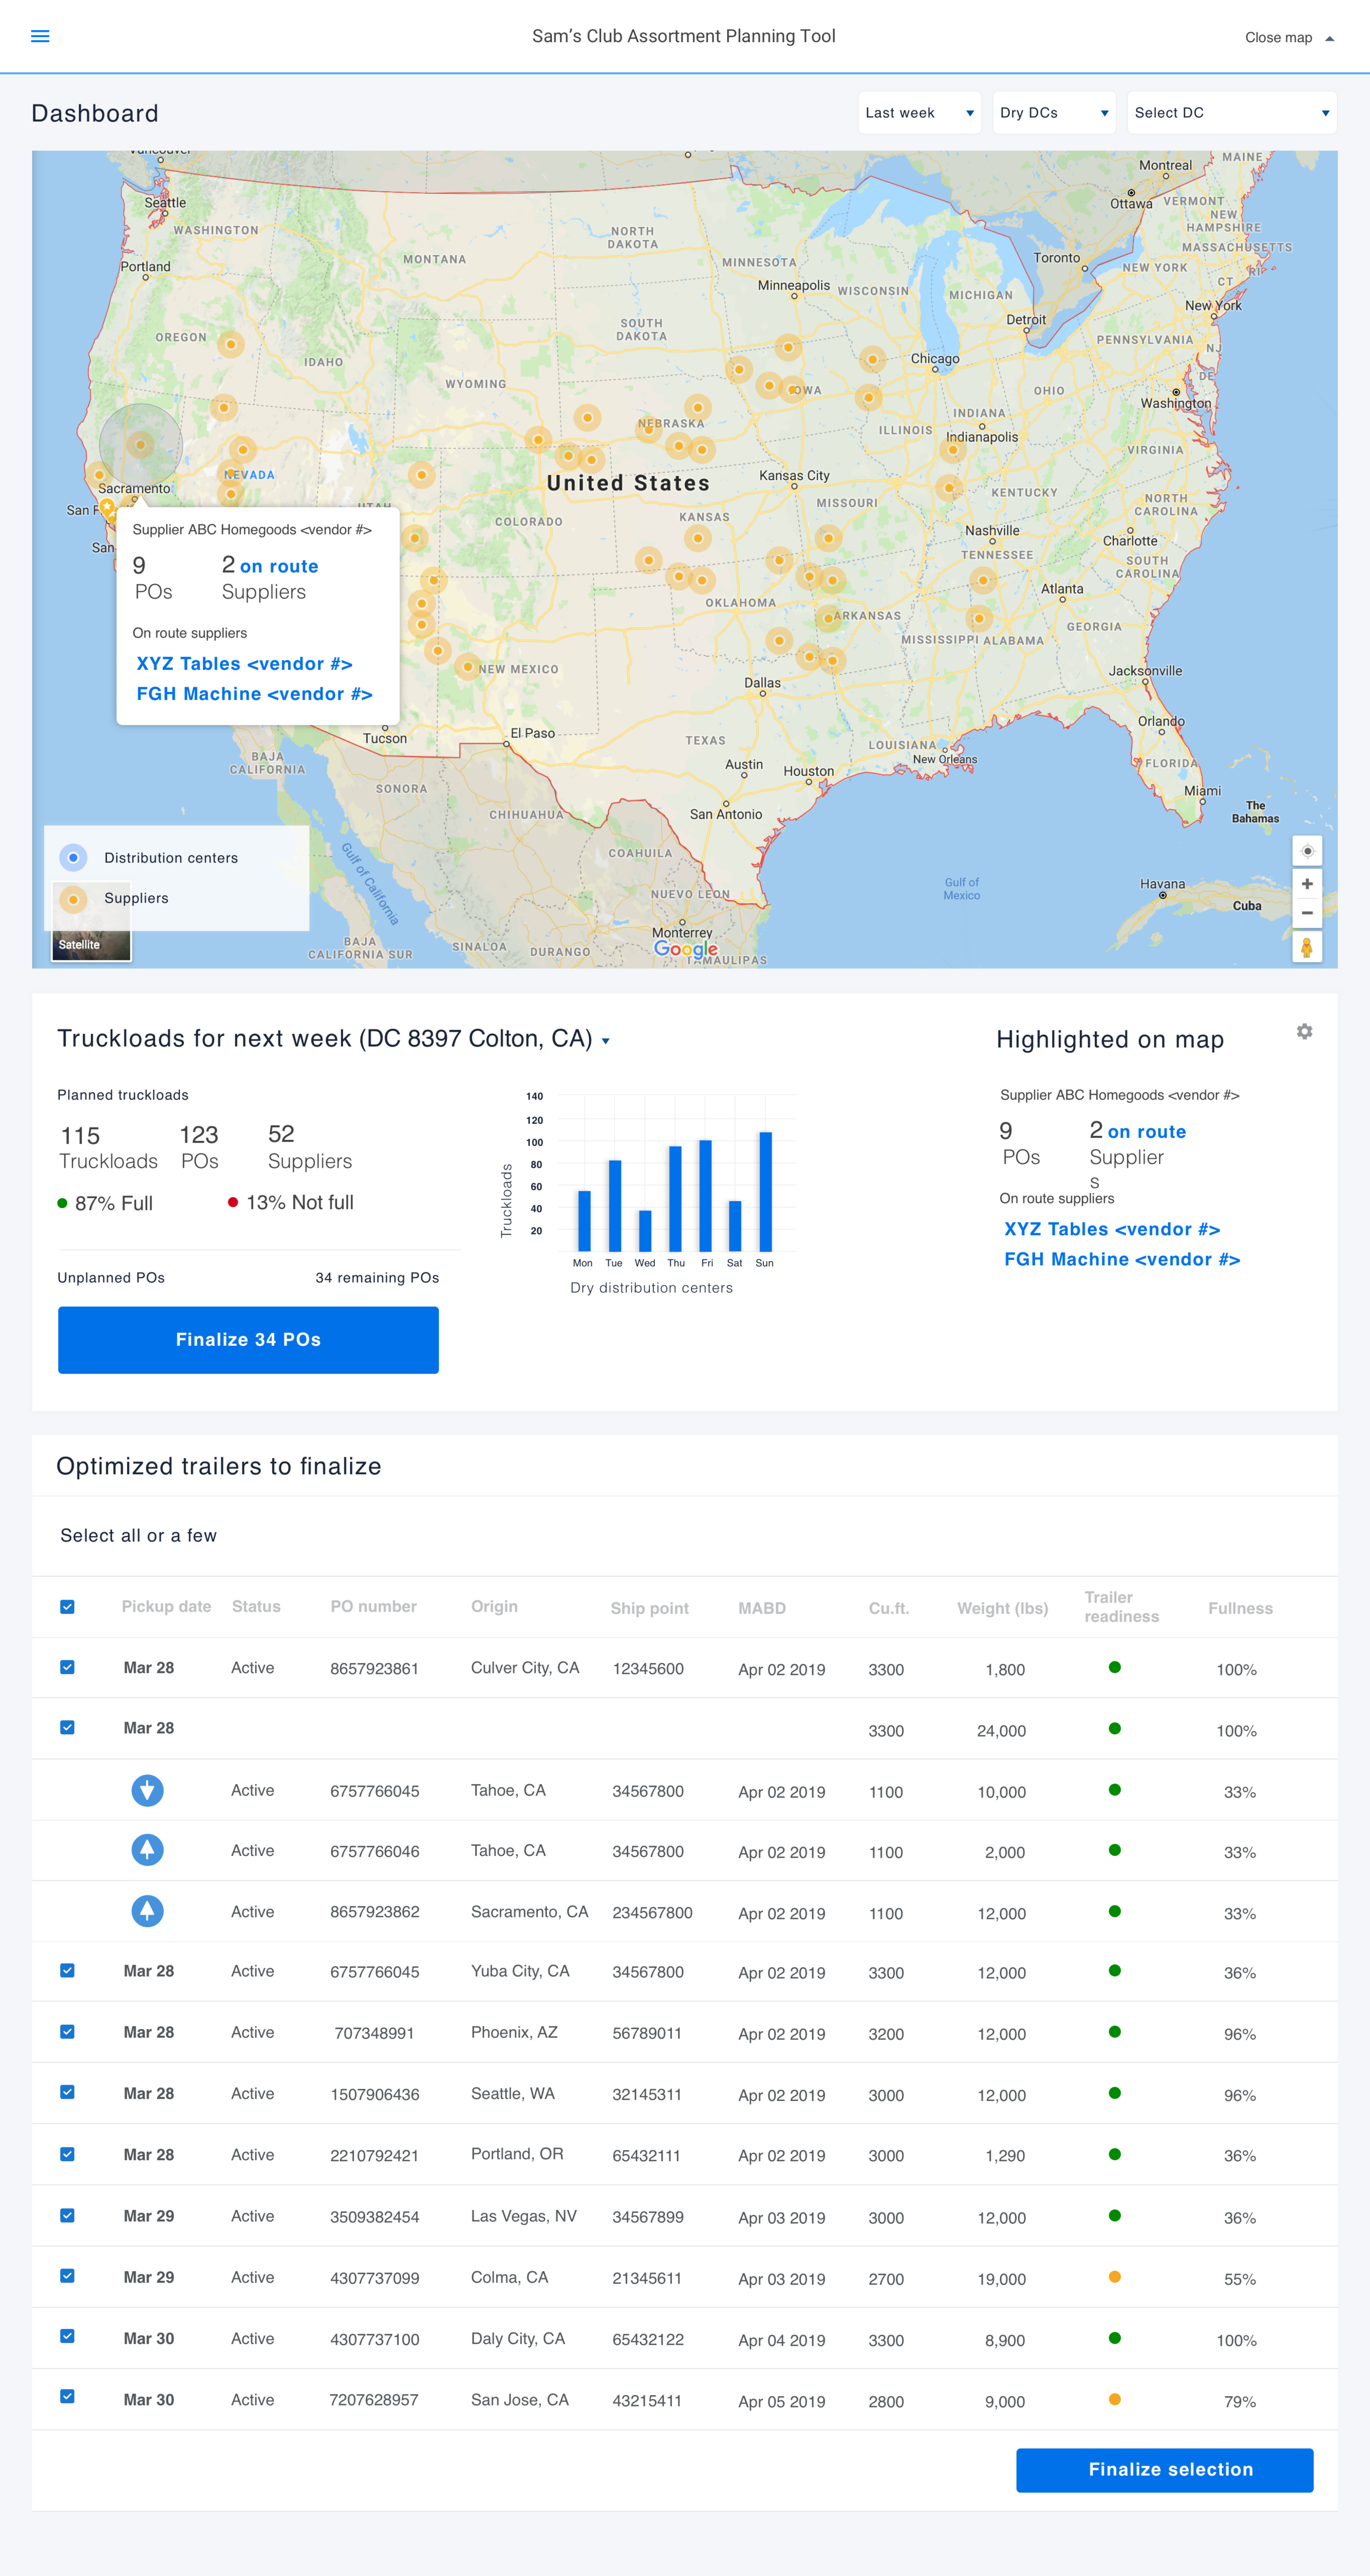
Supply Chain analytics for reviewing truckloads for special event orders from suppliers to distribution centers. The map allowed power users a quick view of the special event supply chain. They could easily drill down to data that would show them live information on the truckload status, their capacity and expected arrivals.
Context
There’s a need to systematically view the en route trucks with merchandise, so we can promise customers these items on special events.
Design goal
Allow the user of this visualization and productivity application to view the status of delivery trucks for any given store or distribution center, for the given time period. One of the more nuanced task was to combine orders by looking at the volume of trucks and routes, so they could be consolidated to save on transportation costs.
Dashboard with visualization